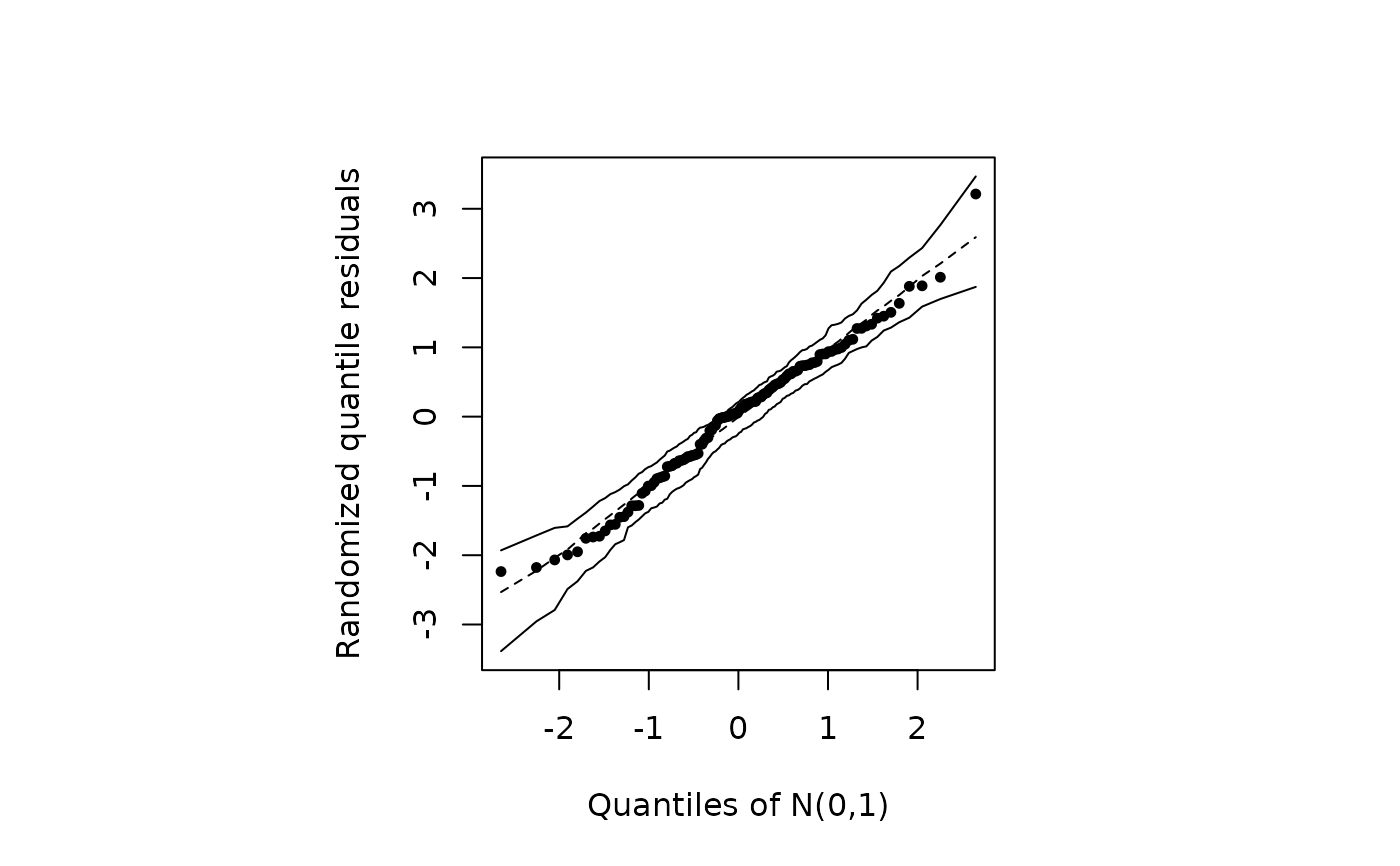
Produces a normal probability (QQ) plot of the randomized quantile residuals together with a simulated envelope, reproducing the residual diagnostic figure of the paper. Points falling outside the envelope indicate poor fit.
Value
Invisibly, a list with components r (observed residuals),
e1 and e2 (lower and upper envelope bounds), and
med (envelope median). A base-graphics plot is produced as a
side effect.