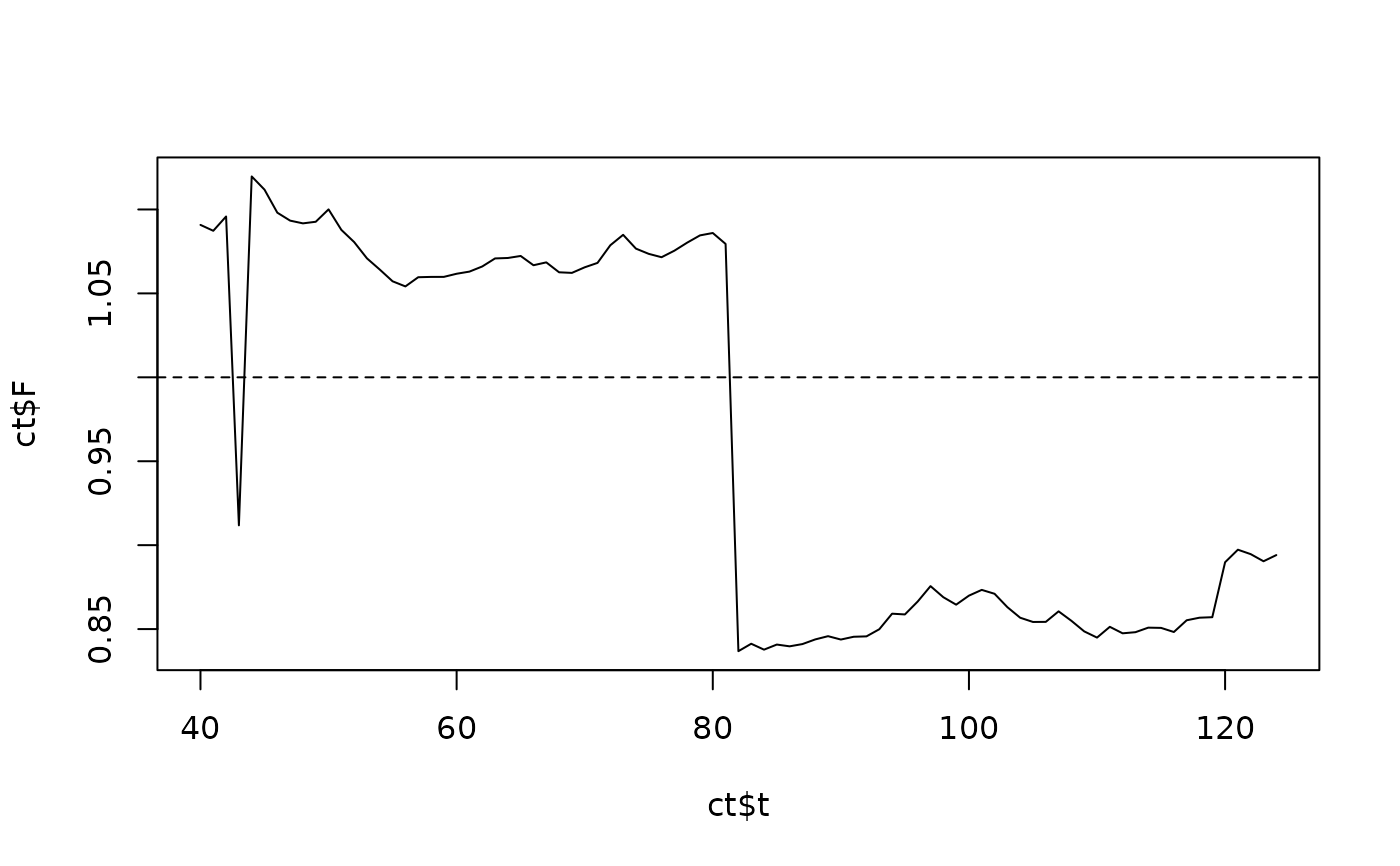
Computes the monitoring index \(F_t\) that combines the conformal normal curvature diagnostic with the finite upper endpoint of the fitted model. The index compares the support the model would infer without the observation flagged by the curvature against the largest response actually observed.
Usage
evbs_monitor(X, y, burn = 40, use = c("curvature", "max"))Value
A data frame with the time index, the running maximum, the flagged
observation, the fitted shape parameter and the index F.
Details
Let \(j^{*}(t)\) be the observation with the largest aggregate contribution when the model is fitted to the first \(t\) records, and \(y_{\max}(t)\) the largest response up to \(t\). Then $$F_t = \hat T^{*}_{(-j^{*}(t))}(t) / y_{\max}(t),$$ where \(\hat T^{*}_{(-j^{*})}\) is the endpoint estimated after deleting the flagged observation, evaluated at its covariate value.
Values below one indicate that the model fitted without the flagged observation assigns probability zero to a value that was in fact observed: the endpoint is then determined by a single record and should not be quoted as a design value. The control limit at one follows from the definition and is not a tuning constant.
Deleting the sample maximum instead of the flagged observation (use =
"max") lowers the endpoint essentially by construction and produces an index
that signals almost everywhere; it is provided for comparison only.