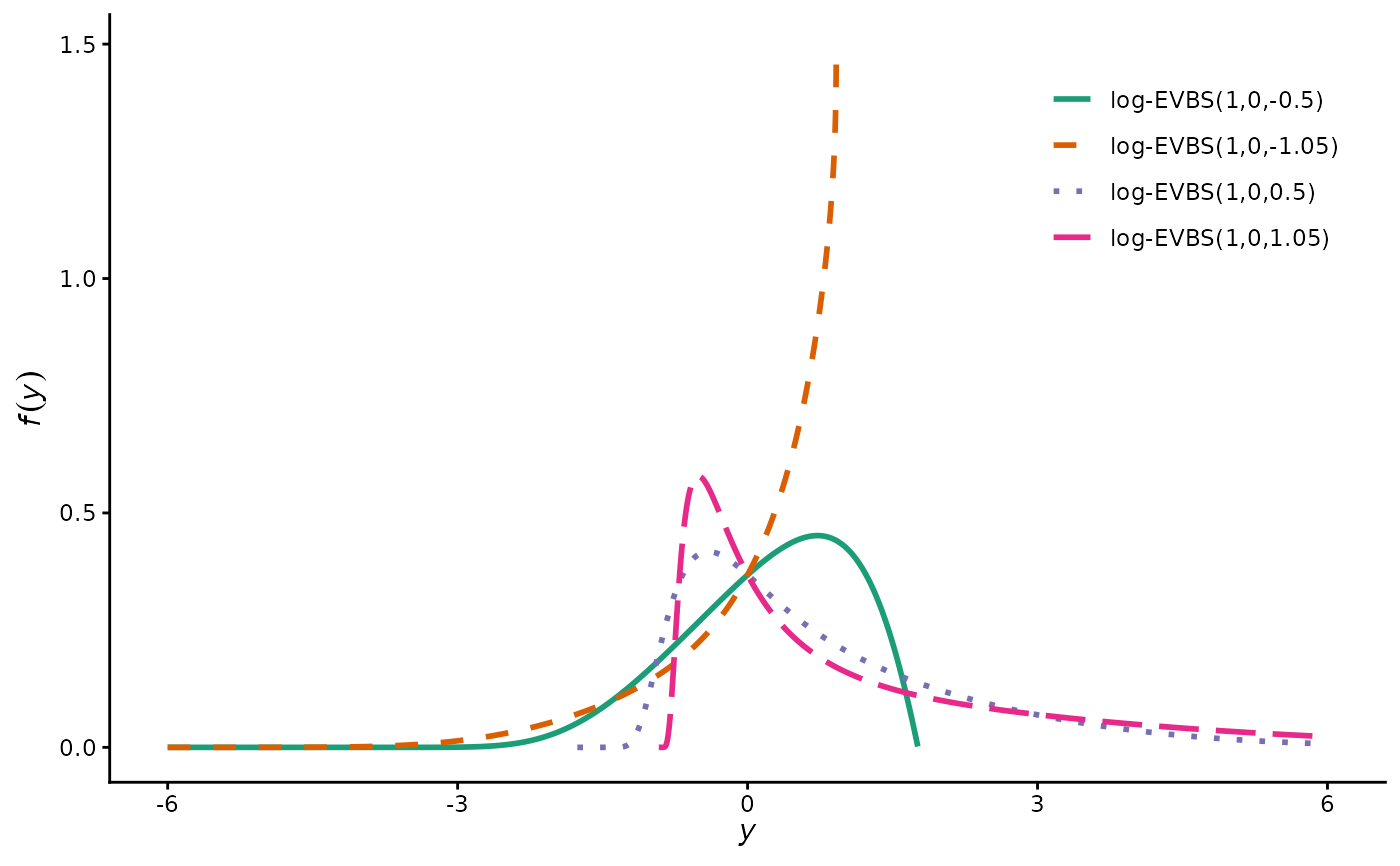
Reproduces Figure 2(b) of the paper: log-EVBS densities for \(\gamma \in \{-1.05, -0.5, 0.5, 1.05\}\), \(\alpha = 1\), \(\eta = 0\). Uses ggplot2 with the Dark2 colour palette.
Examples
print(plot_logevbs_gama())
Reproduces Figure 2(b) of the paper: log-EVBS densities for \(\gamma \in \{-1.05, -0.5, 0.5, 1.05\}\), \(\alpha = 1\), \(\eta = 0\). Uses ggplot2 with the Dark2 colour palette.
print(plot_logevbs_gama())