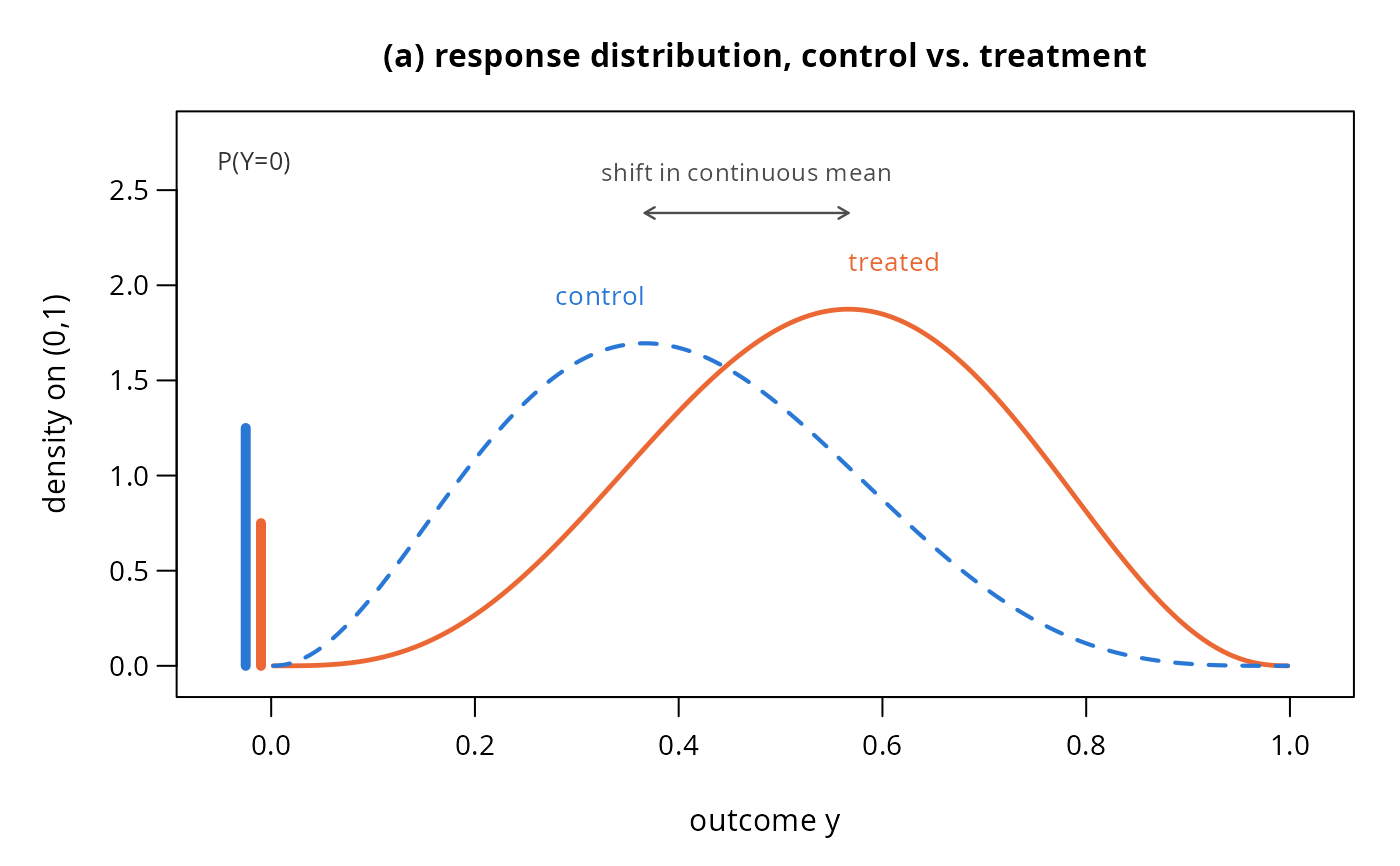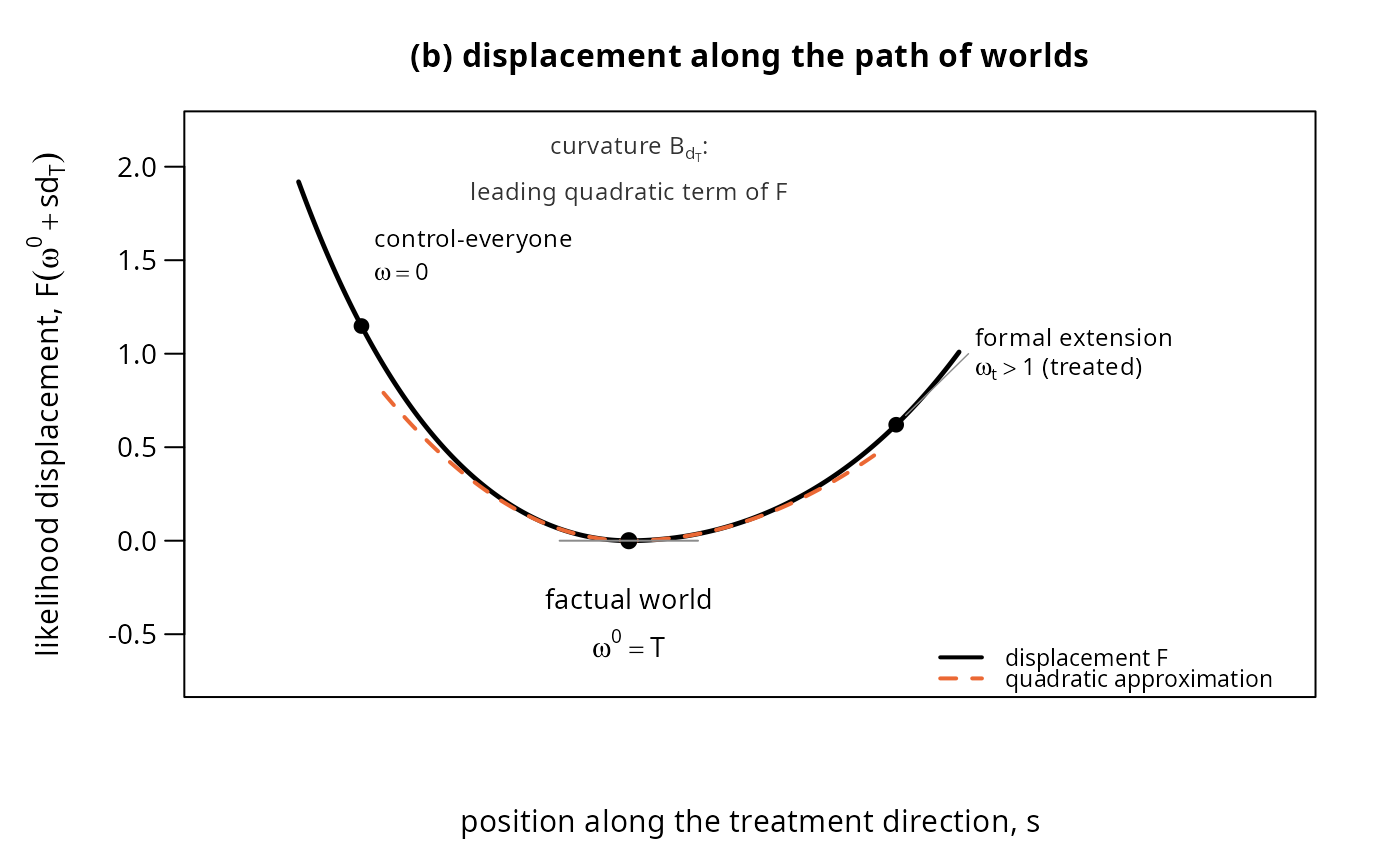
A two-panel, fully synthetic illustration of the paper's diagnostic
layer: (a) how a treatment can separately move the boundary probability
and the continuous mean of an inflated beta response, and (b) the
likelihood-displacement curve \(F\) along the treatment direction,
whose leading quadratic term at the factual world is the curvature
\(B_{d_T}\) of bic_curvature(). Both panels use illustrative
parameters chosen for legibility, not data from the application; no
arguments are needed to reproduce the figure exactly as printed.