
Reproducing the simulation study (Ospina, 2026)
Source:vignettes/paper-simulation.Rmd
paper-simulation.RmdThis vignette reproduces the simulation study of Section 7 of Ospina
(2026), using exactly the data-generating process and parameters of the
manuscript’s paper2_simulation.R (the defaults of
[simulate_bic()] are that same process). It runs end to end from package
functions alone, with no external data.
What tau_alpha and tau_mu mean
Before looking at numbers: tau (the average treatment
effect) is the total change in the mean response caused by treatment.
tau_alpha is the part of that change coming from the
treatment moving units onto or off the boundary (here, the probability
of landing at y = 0); tau_mu is the part
coming from the treatment shifting the conditional mean among units that
remain in the interior. They always add up to tau exactly
(see below), but they can, and in this design do, point in opposite
directions, so a reader who only sees tau cannot tell
whether the treatment acted on the boundary mechanism, the interior
mechanism, both in agreement, or both in opposition with one
dominating.
Population truth
The manuscript reports, from a population of
draws under gamma = c(-1.5, 0.3, 1.5),
beta = c(-1.0, 0.5, 1.2), phi = 4,
rho = 0.4:
,
,
.
A large simulated population reproduces this closely:
set.seed(1)
pop <- simulate_bic(2e5, seed = 1)
unlist(attr(pop, "truth"))
#>         tau   tau_alpha      tau_mu
#>  0.04630878 -0.08753647  0.13384524
Reading this substantively: the treatment actually increases the boundary probability ( here means a lower mean contribution from a higher chance of landing at the boundary, since the boundary is ) while it raises the interior mean enough to overcome that pull (, and larger in magnitude than ). The two components have opposite signs and are each about three times larger than their difference, : the average effect alone would describe this as a modest, roughly homogeneous effect and conceal that two mechanisms of comparable size are pulling in opposite directions.
Estimator behavior at finite samples
The manuscript’s Table 2 reports bias, RMSE and coverage at
over
replications. The loop below does the same at a smaller R,
for vignette build time; set R <- 200 to reproduce Table
2 exactly (seeds match paper2_simulation.R).
run_once <- function(n, seed) {
  dat <- simulate_bic(n, seed = seed)
  fit <- bic_fit(y ~ T + W2, nu.formula = ~ T + W1, data = dat)
  bic_gcomp(fit, "T", dat)
}

R <- 20  ## paper uses R = 200
ns <- c(100, 200, 500)
truth <- unlist(attr(simulate_bic(10, seed = 1), "truth"))

results <- do.call(rbind, lapply(ns, function(n) {
  ests <- t(vapply(seq_len(R), function(r) run_once(n, seed = r), numeric(3)))
  bias <- colMeans(ests) - truth[c("tau", "tau_alpha", "tau_mu")]
  rmse <- sqrt(colMeans(sweep(ests, 2, truth[c("tau", "tau_alpha", "tau_mu")])^2))
  data.frame(n = n, bias_tau = bias["tau"], rmse_tau = rmse["tau"])
}))
rownames(results) <- NULL
results
#>     n      bias_tau   rmse_tau
#> 1 100  0.0104243005 0.05257762
#> 2 200  0.0041251320 0.04348827
#> 3 500 -0.0009232433 0.02760540
RMSE should decline roughly as as grows, and bias should stay an order of magnitude below the effect size () at every , matching Table 2 of the manuscript. In practical terms, this table is the check that the estimator earns the right to be trusted on real data before Section 8 uses it there: a decomposition that looked exact algebraically but recovered the wrong / split in finite samples would be a mathematical curiosity, not an estimator.
The decomposition is an exact identity
Regardless of R or n, the decomposition
holds to floating-point precision on every single fit, not just on
average:
dat <- simulate_bic(300, seed = 99)
fit <- bic_fit(y ~ T + W2, nu.formula = ~ T + W1, data = dat)
g <- bic_gcomp(fit, "T", dat)
g["tau"] - (g["tau_alpha"] + g["tau_mu"])
#> tau
#>   0
This is not a numerical coincidence to be checked once and trusted:
it follows from the inflated beta likelihood being separable (its Fisher
information is block diagonal between the boundary-probability and mean
submodels), so tau_alpha and tau_mu are not
two separate estimates that happen to sum correctly, they are the same
single fitted model read two ways. That is also why misspecifying the
boundary submodel does not contaminate the mean submodel’s parameters
(though it does bias the weight tau_mu is averaged
with, since that weight is a boundary probability); see Section 4 of the
manuscript.
Figures
causalbic also ships the plotting functions behind two
of the manuscript’s figures, so they can be regenerated from the package
alone, not just their underlying numbers. Both are fully self-contained
(no external data): [plot_concept()] draws the synthetic two-panel
illustration of the discrete/continuous decomposition and the
likelihood-displacement curve behind the causal curvature (Figure 1);
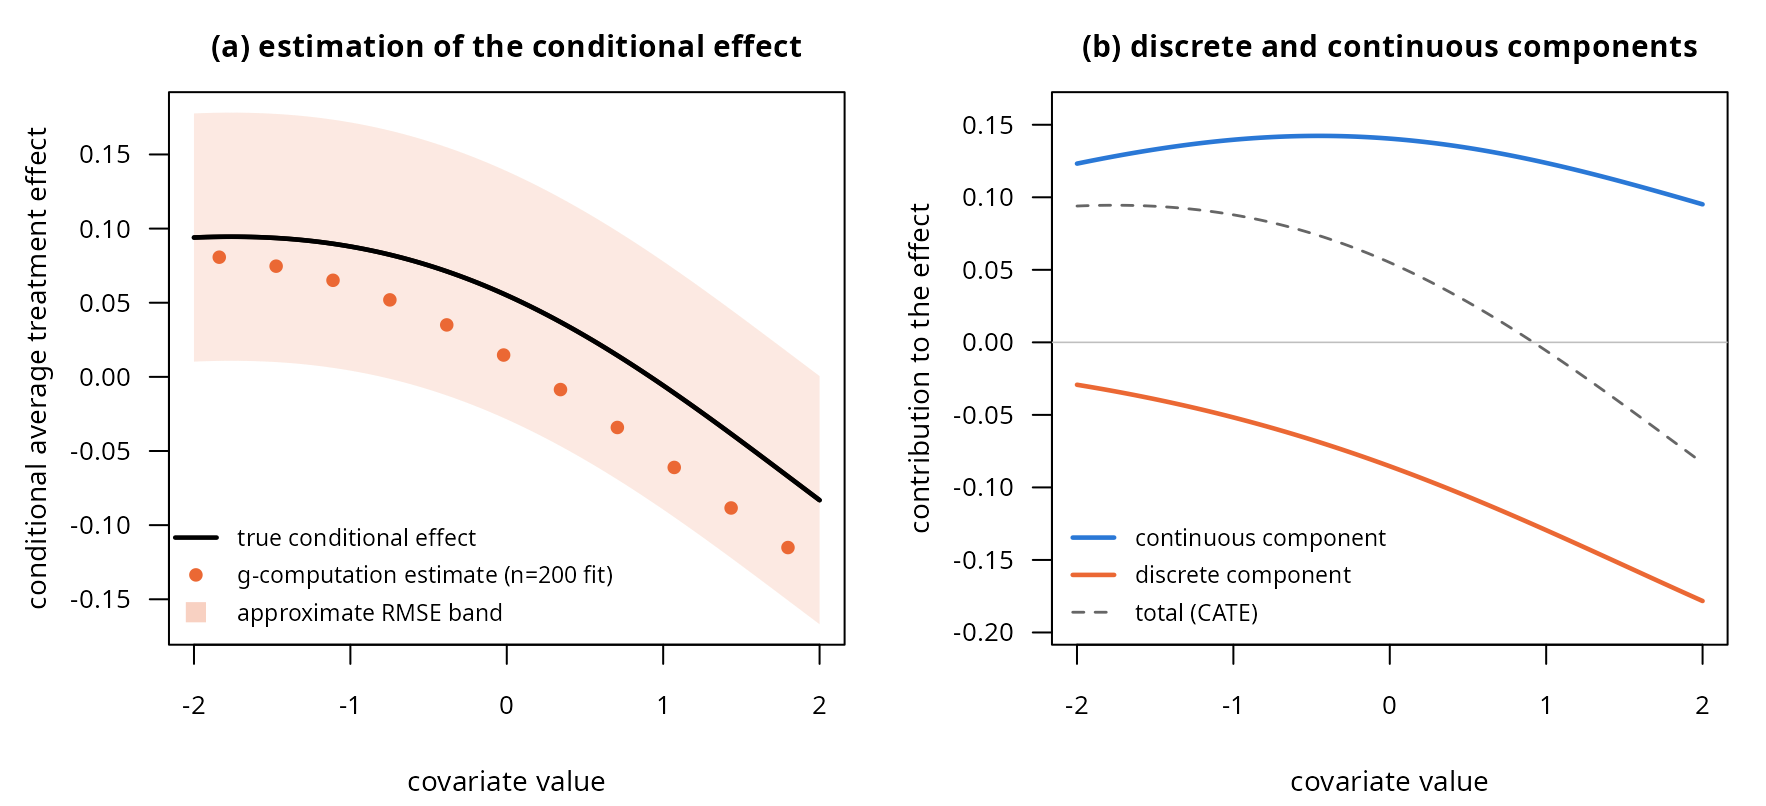
[plot_cate()] simulates one dataset from the same process as above, fits
it, and plots the true and estimated conditional average treatment
effect alongside its two components (Figure 2).
par(mfrow = c(1, 2))
plot_concept()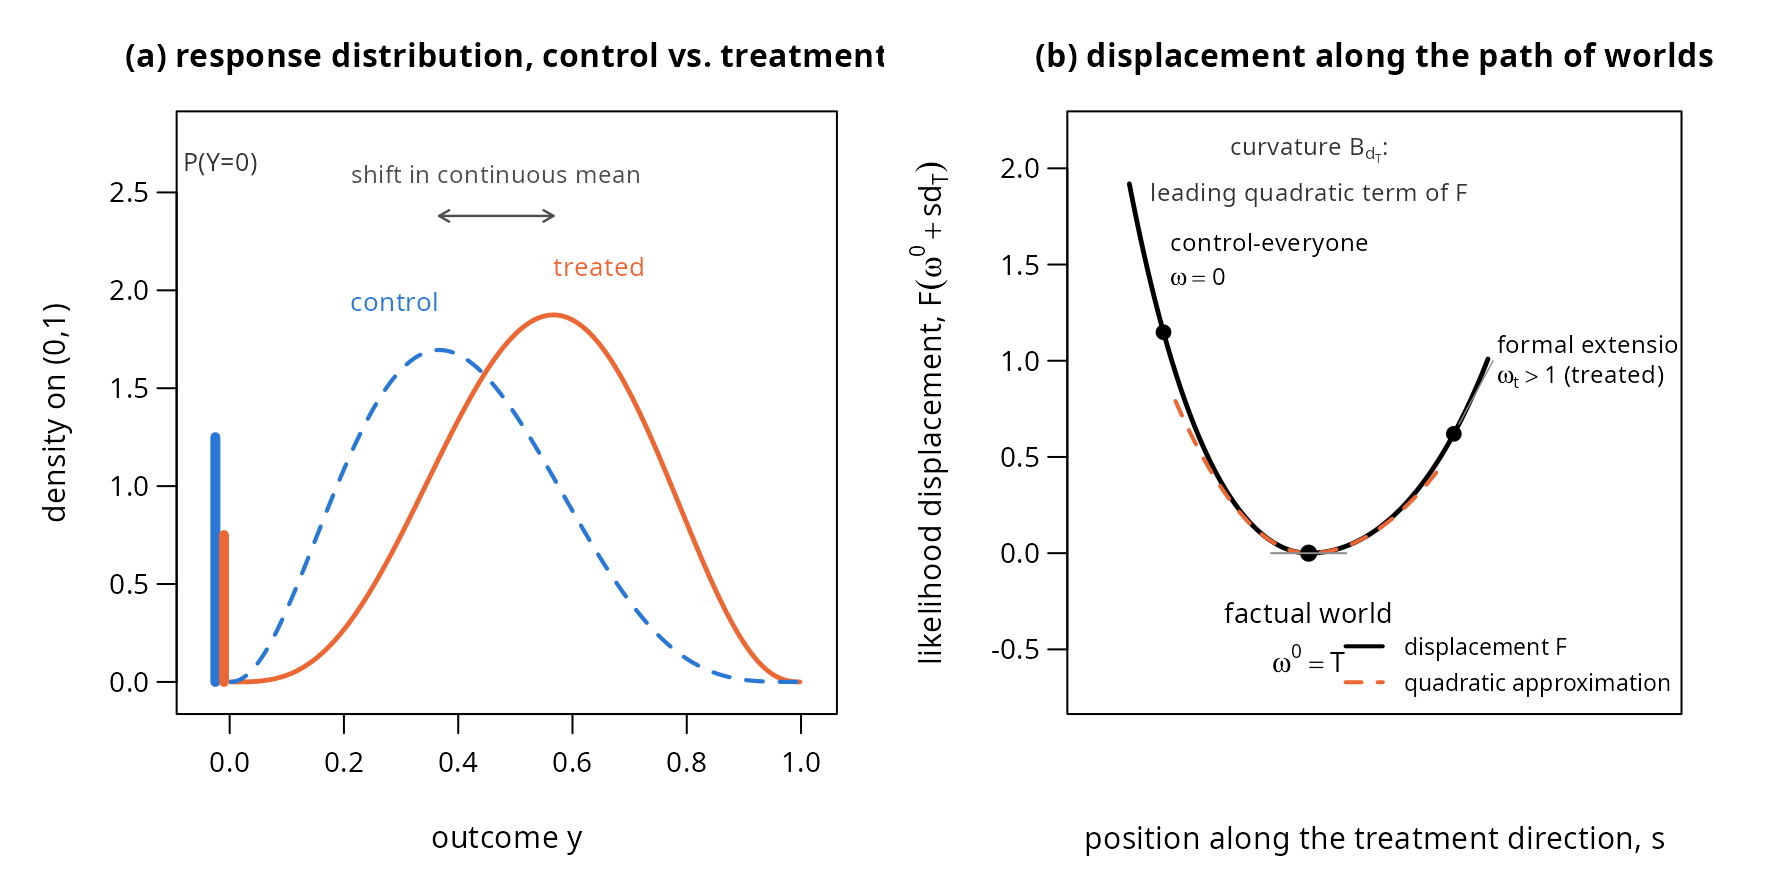
(A third figure, the application’s goodness-of-fit diagnostics, needs
a fitted model on real data and is shown in
vignette("paper-application") via
[plot_diagnostics()].)