The conditional average treatment effect figure (Figure 2 of Ospina, 2026)
Source:R/plots.R
plot_cate.RdSimulates one dataset from simulate_bic(), fits it with bic_fit(),
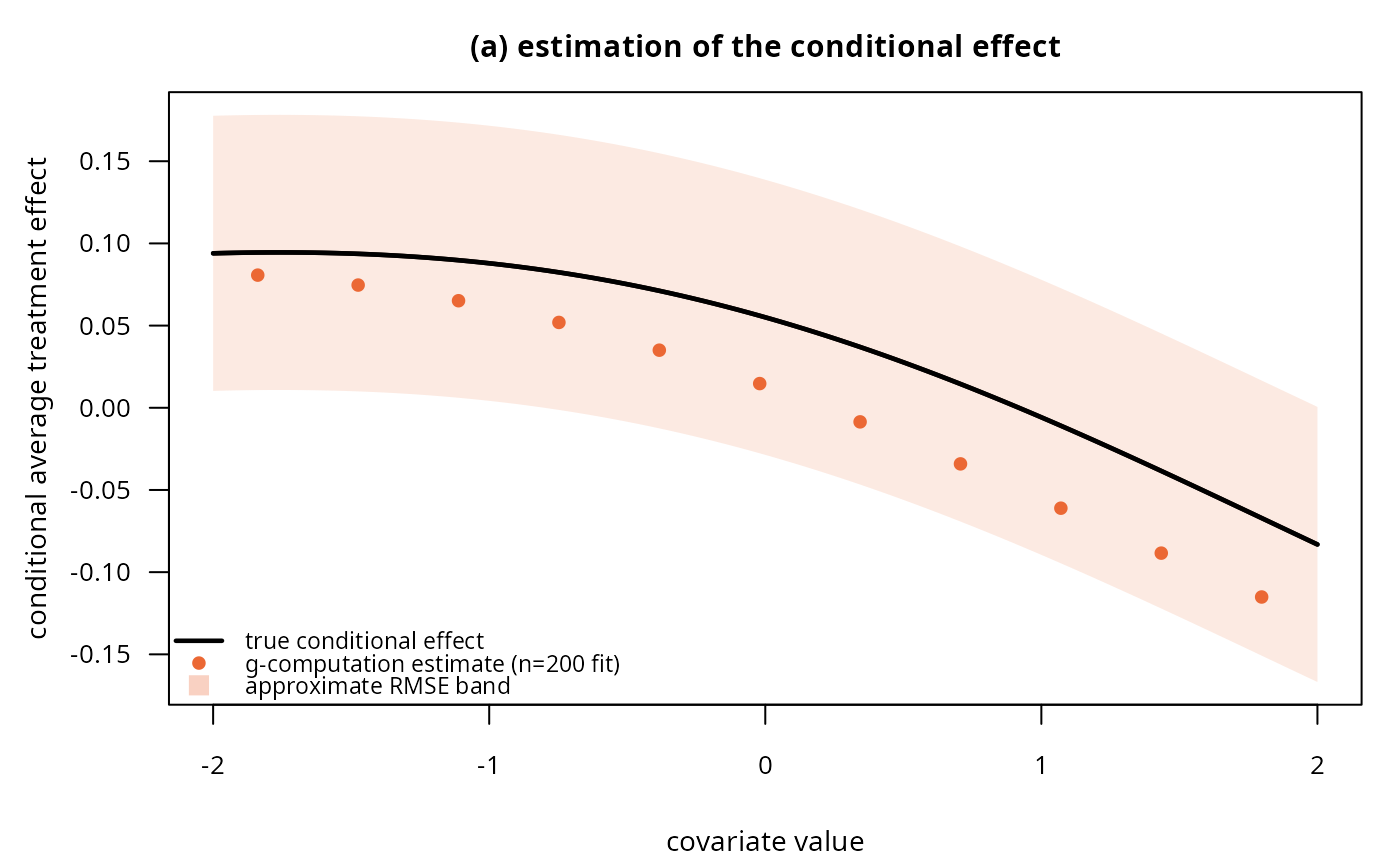
and plots (a) the true conditional average treatment effect (CATE)
against the g-computation estimate from that single fit, with an RMSE
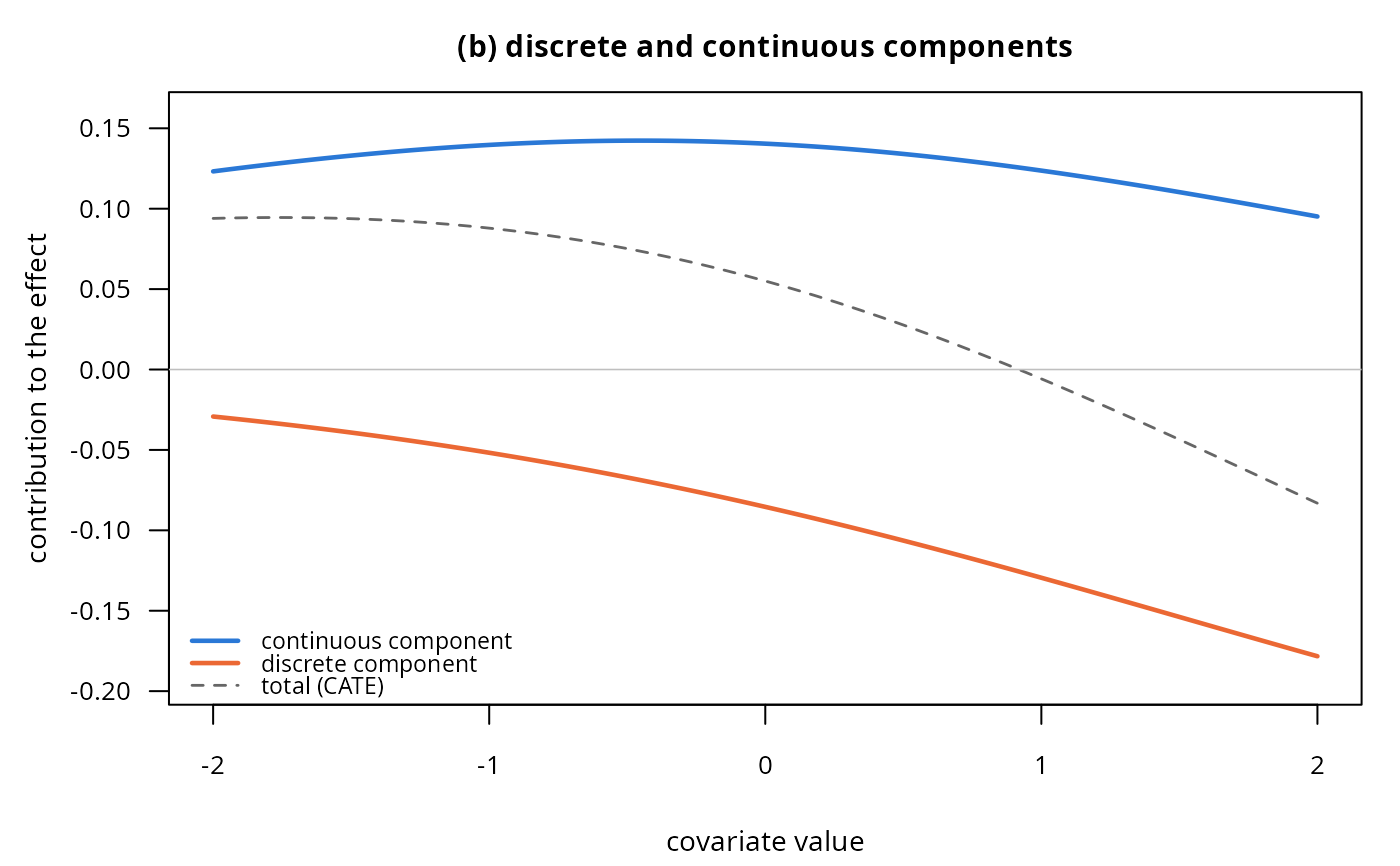
band, and (b) the true discrete- and continuous-component contributions
that add up to the CATE (the population-level counterpart of panel (b)
of plot_concept()).
Arguments
- n, seed, gamma, beta, phi, rho
As in
simulate_bic(); the defaults reproduce the paper's figure exactly.- rmse
Half-width of the plotted uncertainty band around the true CATE in panel (a). Defaults to
0.0427, theR = 200-replicate,n = 200root-mean-squared error at the median covariate profile reported in Table 2 of Ospina (2026); this is not recomputed by this function (that would need hundreds of refits), so pass your own value if you changenor the generating parameters.
Value
Invisibly, a list with grid (the covariate values plotted),
truth (a data frame of tau, tau_alpha, tau_mu at each grid
point) and estimate (the g-computation CATE from the single fitted
model). Called mainly for its plotting side effect; draws both panels
in the current graphics device (set par(mfrow = c(1, 2)) first).