Growth-curve ensembles and phases of an epidemic
Source:vignettes/piecewise-ensemble-article.Rmd
piecewise-ensemble-article.RmdThis vignette shows the functions behind the article on locating phase changes in epidemic curves (Ospina, Oliveira, Ferraz and Leite). The segmentation runs take one to several minutes each and are shown but not run.
Growth curves on daily counts
A cumulative growth curve
implies the daily mean
.
fit_growth_incidence() fits one curve to daily counts by
Poisson or negative binomial likelihood, and
fit_ensemble_incidence() fits the Logistic, Gompertz and
Richards curves and combines them with Akaike weights.
u <- 1:100
mu <- growth_incidence(u, "gompertz", y0 = 10, K = 3000, gamma = 0.05)
set.seed(1)
x <- rpois(100, mu)
ens <- fit_ensemble_incidence(x, family = "poisson")
round(ens$weights, 3)
#> gompertz richards logistic
#>        1        0        0
plot(u, x, pch = 19, cex = 0.6, xlab = "Day", ylab = "Daily count")
lines(u, predict(ens, u), lwd = 2)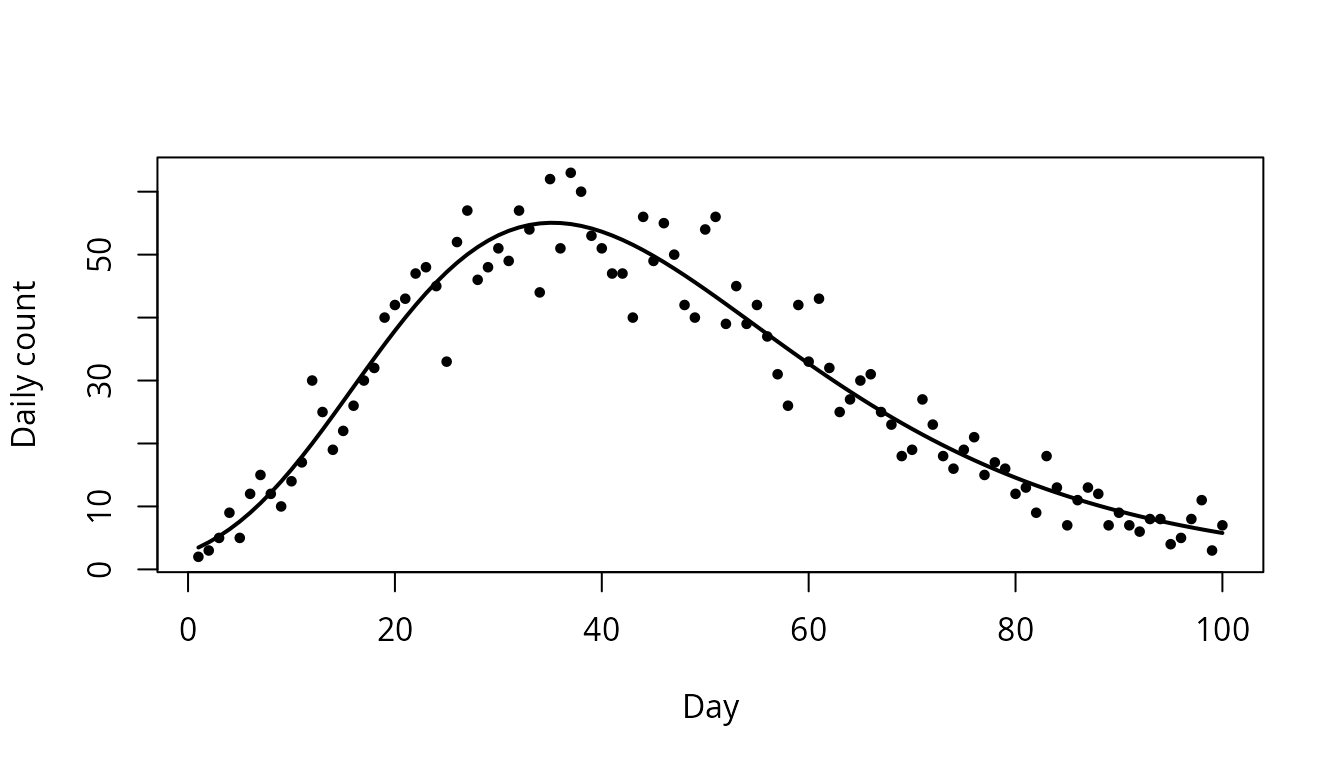
Dividing a series into phases
bic_segment() divides a completed series by binary
segmentation with a penalised likelihood on the daily scale.
edetect_segment() monitors the series as it arrives with
two one-sided e-detectors (package edetect), which
compare each count with a band around the forecast of the current phase
and bound the probability of a false alarm at any time when the band
contains the conditional mean. With z = 0 the band is the
point forecast itself; a band of one standard error (z = 1)
allows for the error in the forecast.
data(paraiba_covid19)
deaths <- paraiba_covid19$new_deaths
seg <- bic_segment(deaths, d_min = 12, family = "negbin", step = 5)
paraiba_covid19$date[seg$cuts]
det <- edetect_segment(deaths, d_min = 20, arl = 1000, refit_every = 7,
                       chart = "subgaussian", z = 1)
paraiba_covid19$date[det$cuts]
paraiba_covid19$date[det$alarms]
For overdispersed counts, use the negative binomial family in
bic_segment() and the sub-Gaussian chart in
edetect_segment(); with the Poisson chart, daily case
counts whose variance far exceeds their mean are read as a sequence of
changes.
The earlier approach on cumulative counts
fit_piecewise_ensemble() implements the earlier rule,
which fits the curves to cumulative counts by least squares and accepts
a split when it halves the mean squared error
(confirm_criterion = "mse_threshold") or lowers a BIC
computed from the cumulative residuals
(confirm_criterion = "aic"). In the simulation study of the
article both variants divided series generated by a single growth curve
into several phases, because the errors of a cumulative series are
strongly autocorrelated; the functions are kept to reproduce the earlier
analyses.