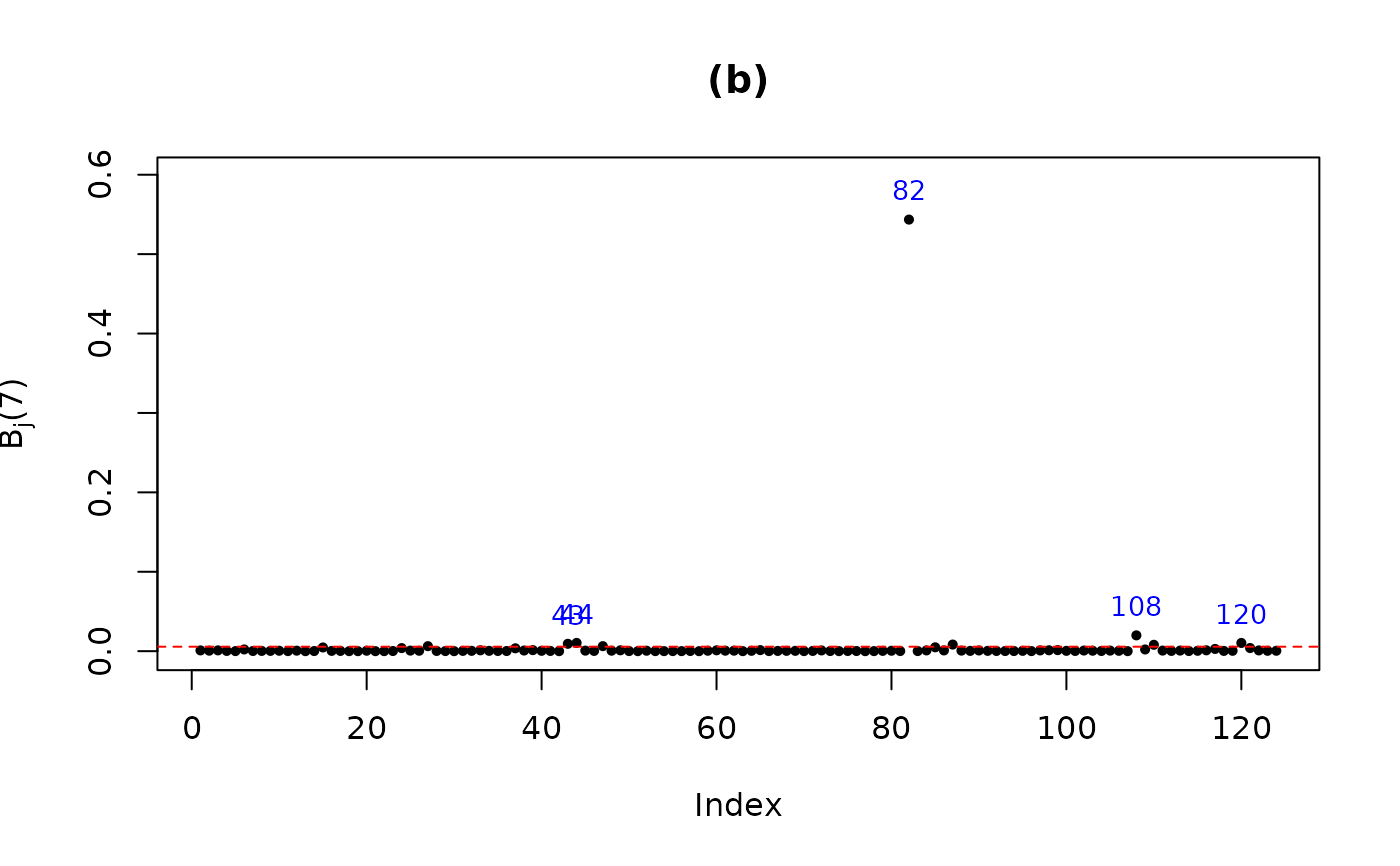
Produces panel (b) of the diagnostic figure: the aggregate contributions \(B_j(q)\) of each observation, with a horizontal reference line at \(b(q)\) and automatic labelling of the most influential points.
Usage
plot_aggregate_contributions(
  diag,
  q = 7,
  label.flagged = 5,
  pch = 16,
  cex = 0.7,
  main = ""
)
Arguments
- diag
A list returned by
cnc_diagnostics.- q
Integer influence threshold in \(1, \ldots, 7\). The paper uses
q = 7.- label.flagged
Number of largest observations to label.
- pch
Plotting character (default
16).- cex
Point size expansion (default
0.7).- main
Plot title (default empty).
Value
The indices of the labelled observations, returned invisibly. Also produces a base-graphics plot as a side effect.
Examples
data(itajai)
fit <- evbsreg.fit(cbind(1, itajai$pressure), itajai$wind)
diag <- cnc_diagnostics(fit)
plot_aggregate_contributions(diag, q = 7, main = "(b)")