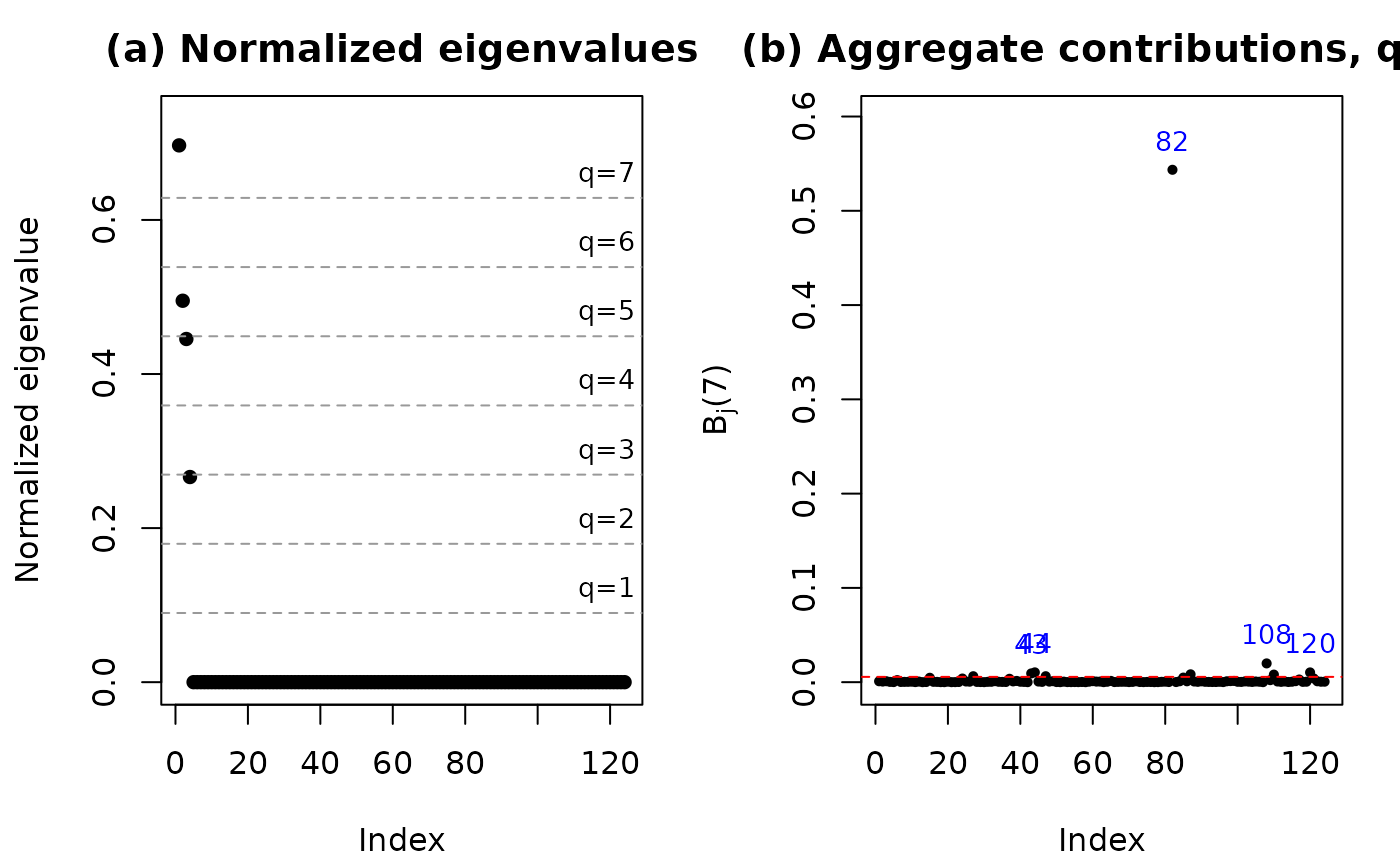
Produces the two-panel diagnostic figure of the paper: normalized eigenvalues (left) and aggregate contributions \(B_j(q)\) (right), side by side.
Arguments
- diag
A list returned by
cnc_diagnostics.- q
Integer influence threshold in \(1, \ldots, 7\) (default
7).- label.flagged
Number of largest observations to label in the right panel (default
5).
Examples
data(itajai)
fit <- evbsreg.fit(cbind(1, itajai$pressure), itajai$wind)
diag <- cnc_diagnostics(fit)
plot_cnc(diag, q = 7)