Plot Normalized Eigenvalues of the Influence Matrix
Source:R/evbsreg_diagnostics.R
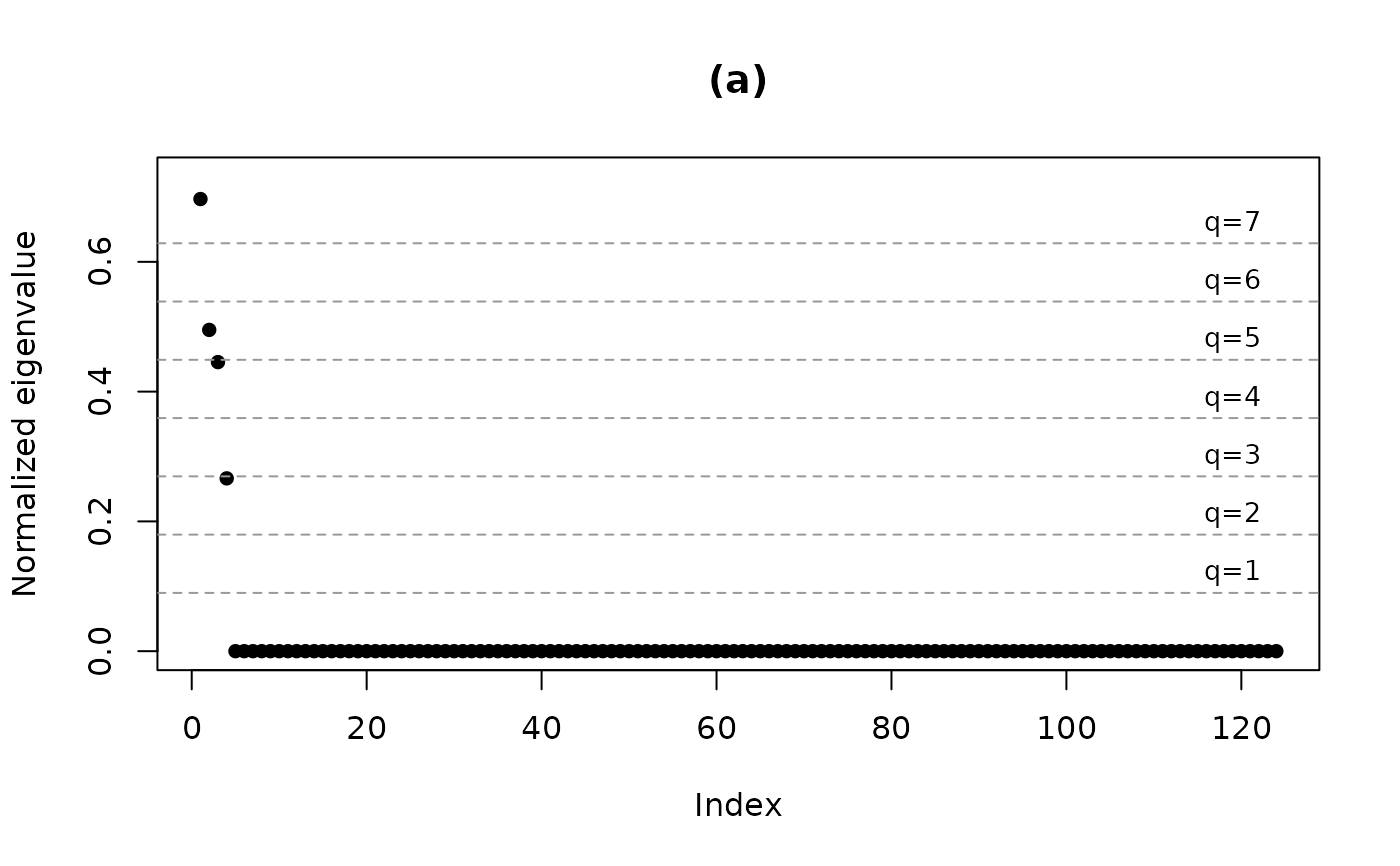
plot_normalized_eigenvalues.RdProduces panel (a) of the diagnostic figure: the normalized eigenvalues of the influence matrix, with horizontal reference thresholds for \(q = 1, \ldots, 7\).
Arguments
- diag
A list returned by
cnc_diagnostics.- pch
Plotting character (default
16).- cex
Point size expansion (default
1).- main
Plot title (default empty).
Examples
data(itajai)
fit <- evbsreg.fit(cbind(1, itajai$pressure), itajai$wind)
diag <- cnc_diagnostics(fit)
plot_normalized_eigenvalues(diag, main = "(a)")