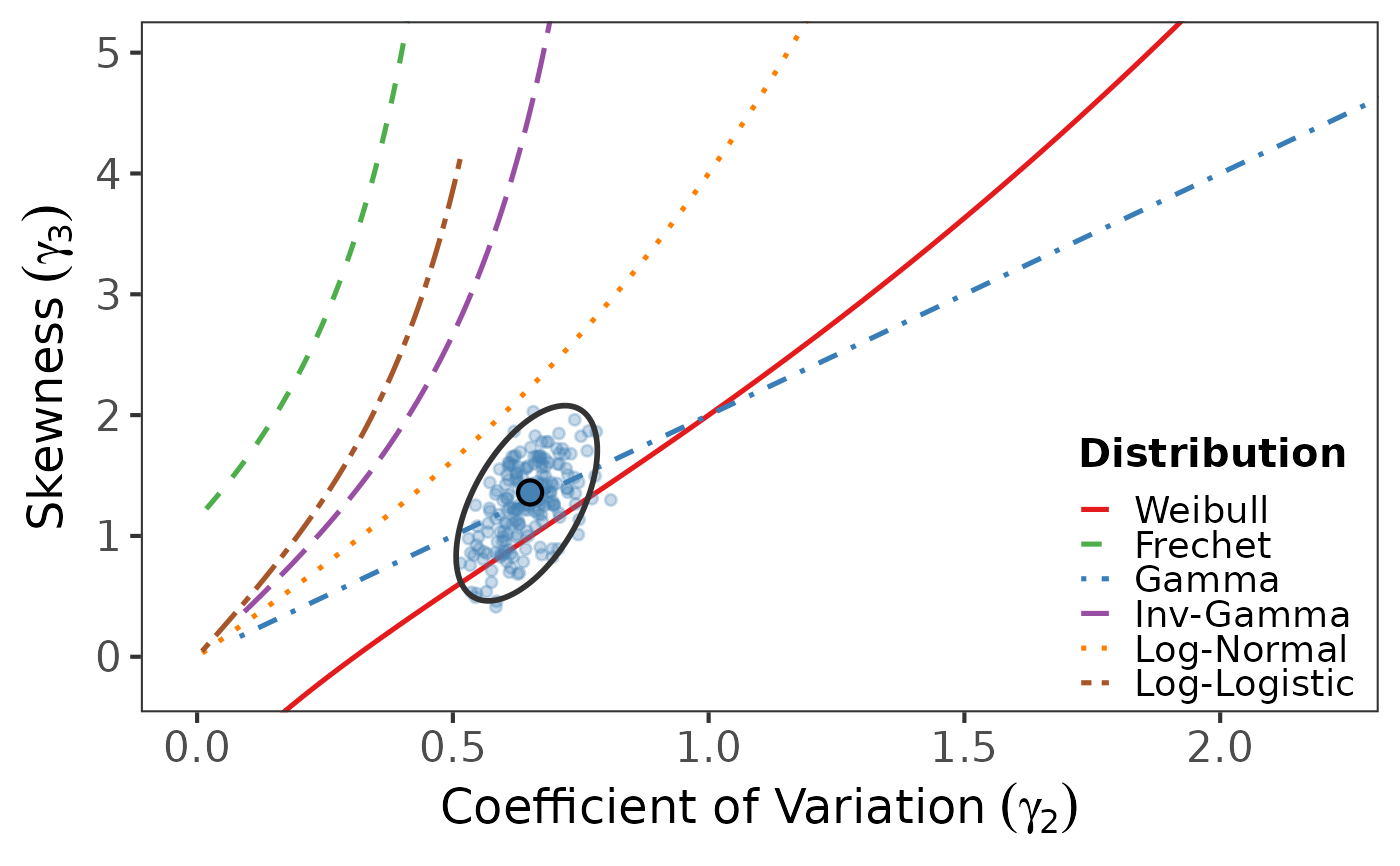
Draws the coefficient-of-variation diagnostic diagram on the original scale
(CV \(\gamma_2\) versus skewness \(\gamma_3\)) with theoretical loci,
bootstrap cloud, and 95% concentration ellipse.
Usage
cv_diagram(
  data,
  data_name = "Dataset",
  B = NULL,
  seed = 42,
  level = 0.95,
  xlim = c(0, 2.2),
  ylim = c(-0.2, 5)
)
Arguments
- data
Numeric vector of positive observations.
- data_name
Character; label used in the title.
- B
Integer; bootstrap replicates (default chosen adaptively from n).
- seed
Integer random seed.
- level
Numeric; ellipse confidence level (default 0.95).
- xlim, ylim
Numeric length-2 axis limits.
Examples
data(reliability_datasets)
cv_diagram(reliability_datasets$Yarn, "Yarn", B = 200)