library(logcumulant)
data(reliability_datasets)
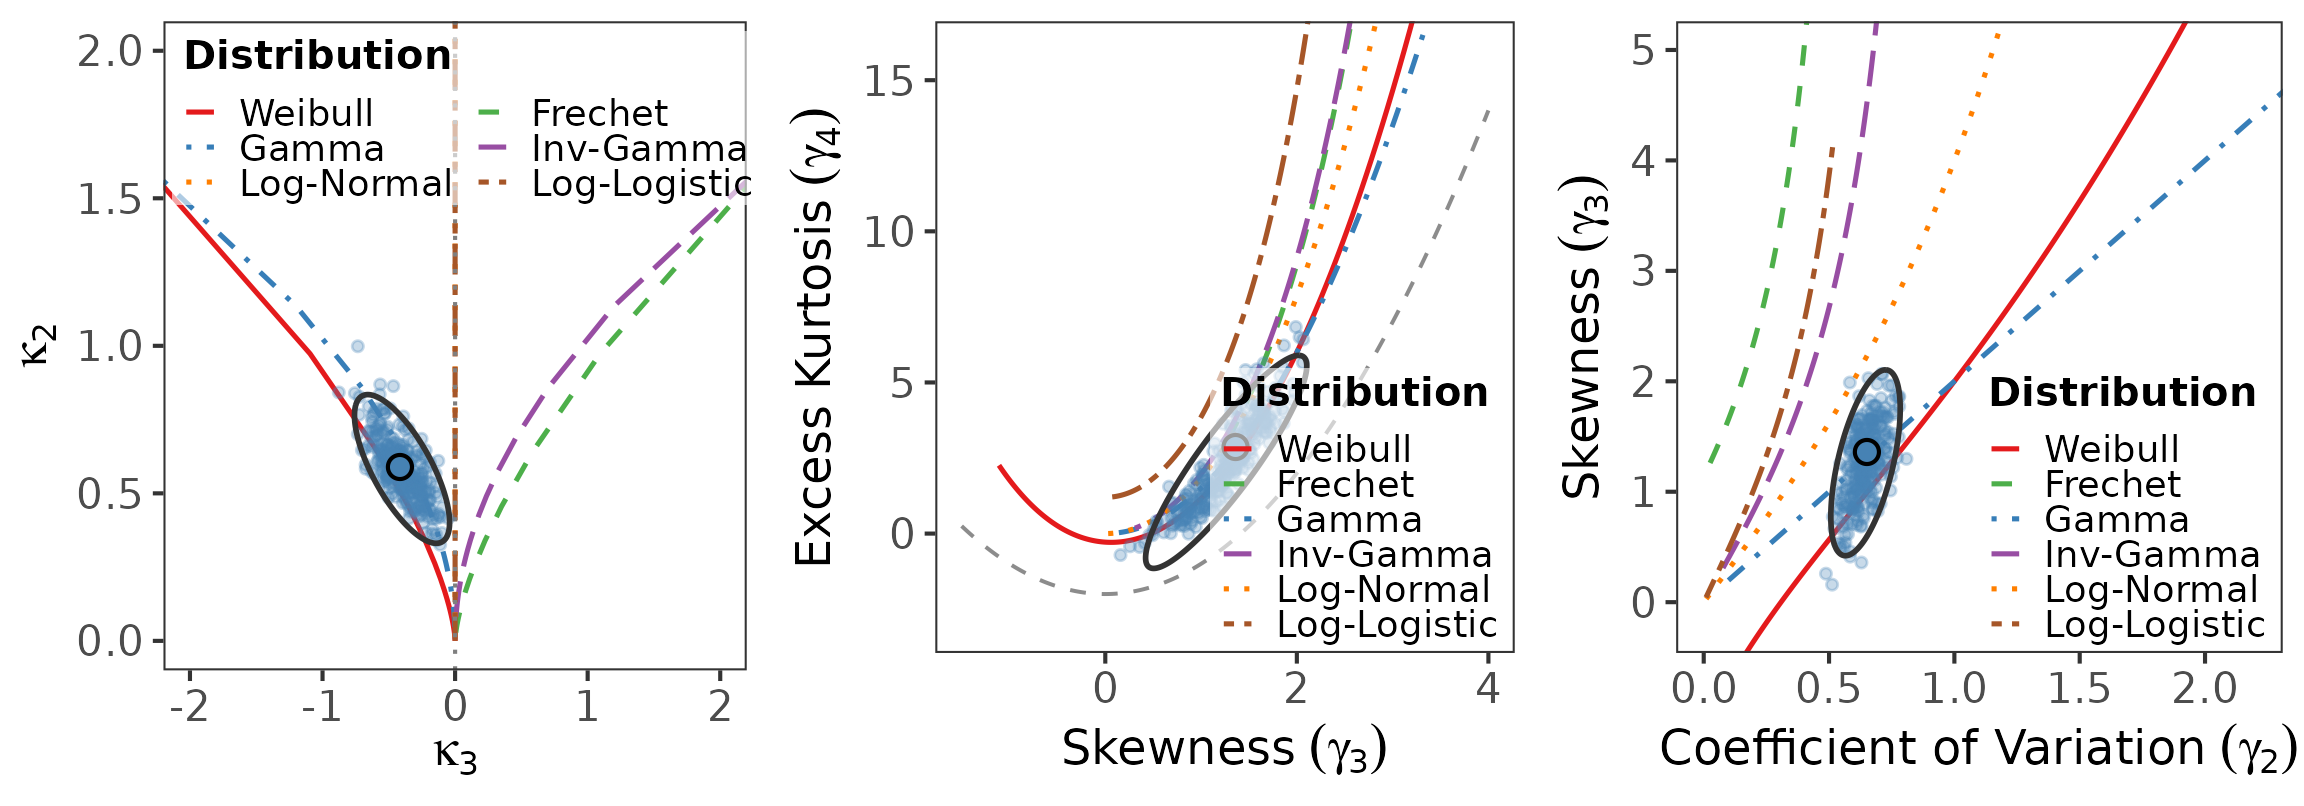
yarn <- reliability_datasets$YarnThe package provides three complementary moment-ratio diagrams. Each overlays the theoretical loci of the six reference families with a bootstrap cloud of the sample estimate and a 95% concentration ellipse.
Log-cumulant diagram
Plots (log-skewness) against (log-variance). The vertical axis is where the symmetric-on-the-log-scale families (Log-Normal, Log-Logistic) lie.
log_cumulant_diagram(yarn, "Yarn", B = 300)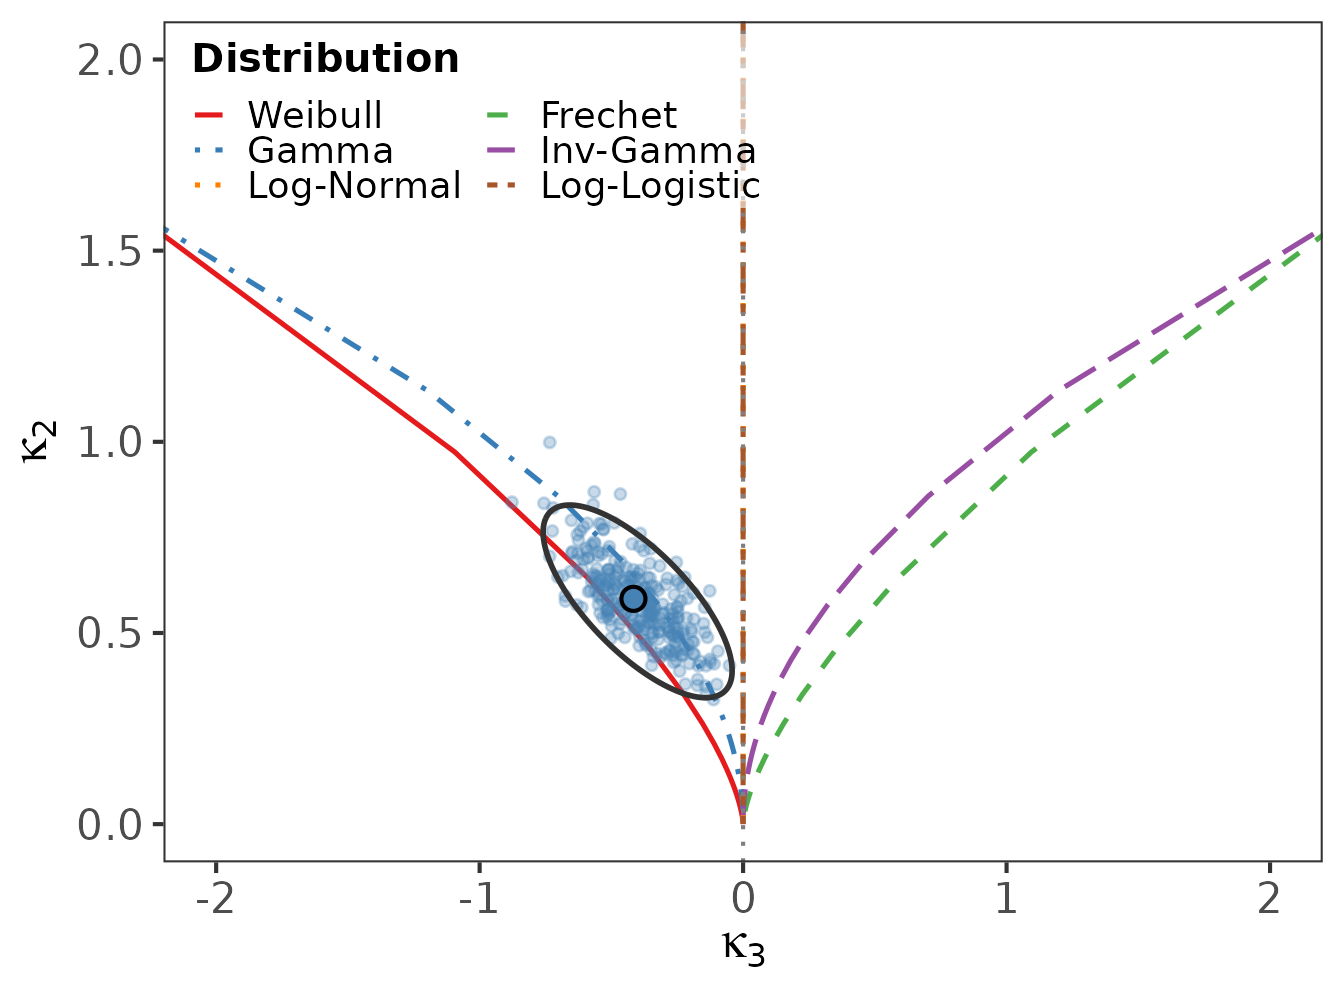
Kurtosis-skewness diagram
On the original scale: skewness versus excess kurtosis , with the feasible-region boundary .
kurtosis_diagram(yarn, "Yarn", B = 300)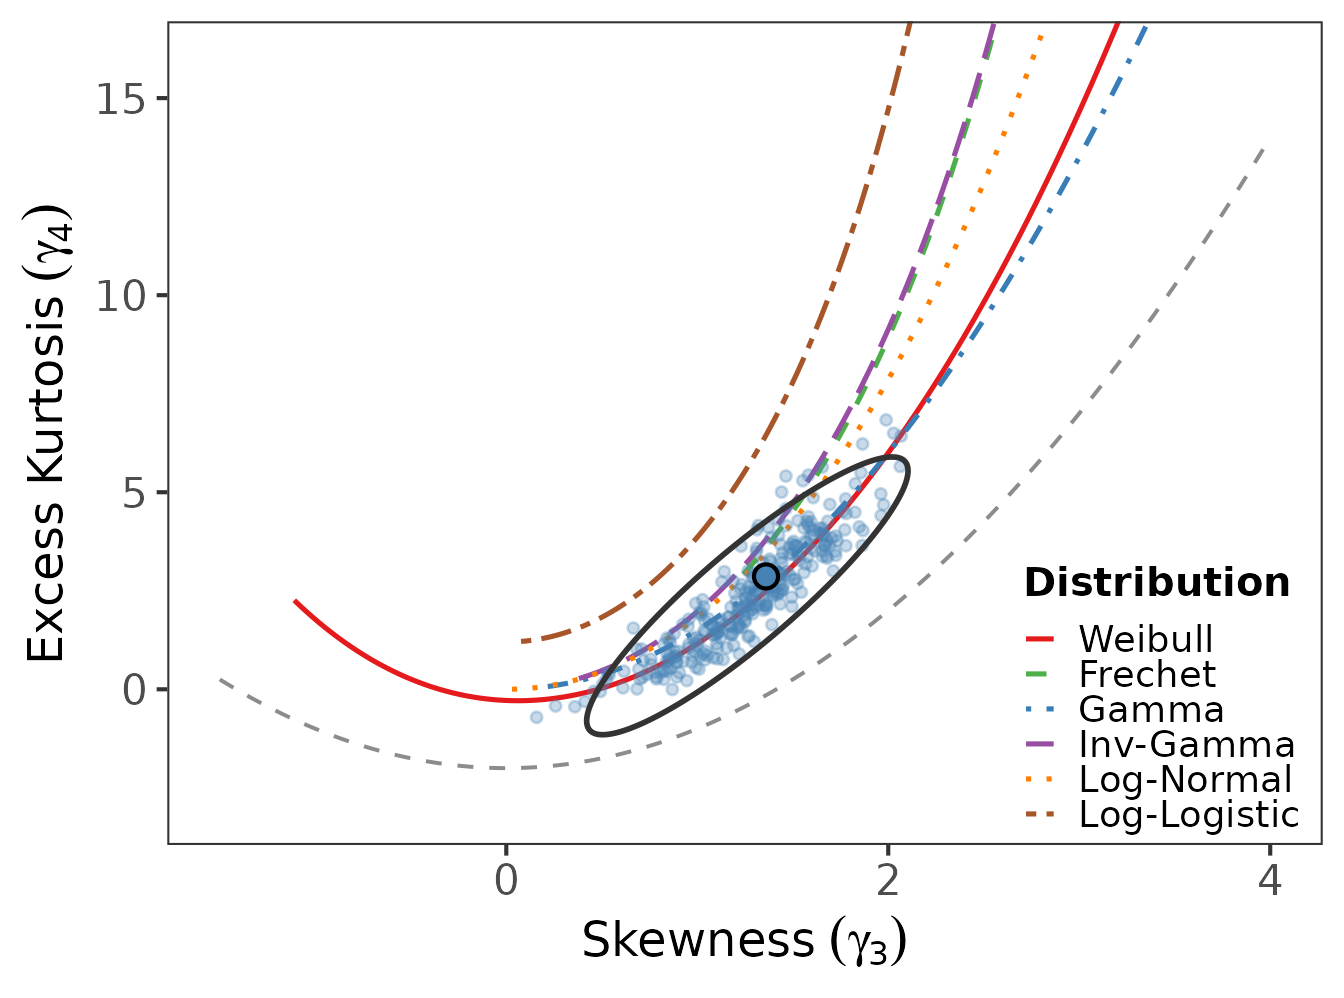
Coefficient-of-variation diagram
Coefficient of variation versus skewness , again on the original scale.
cv_diagram(yarn, "Yarn", B = 300)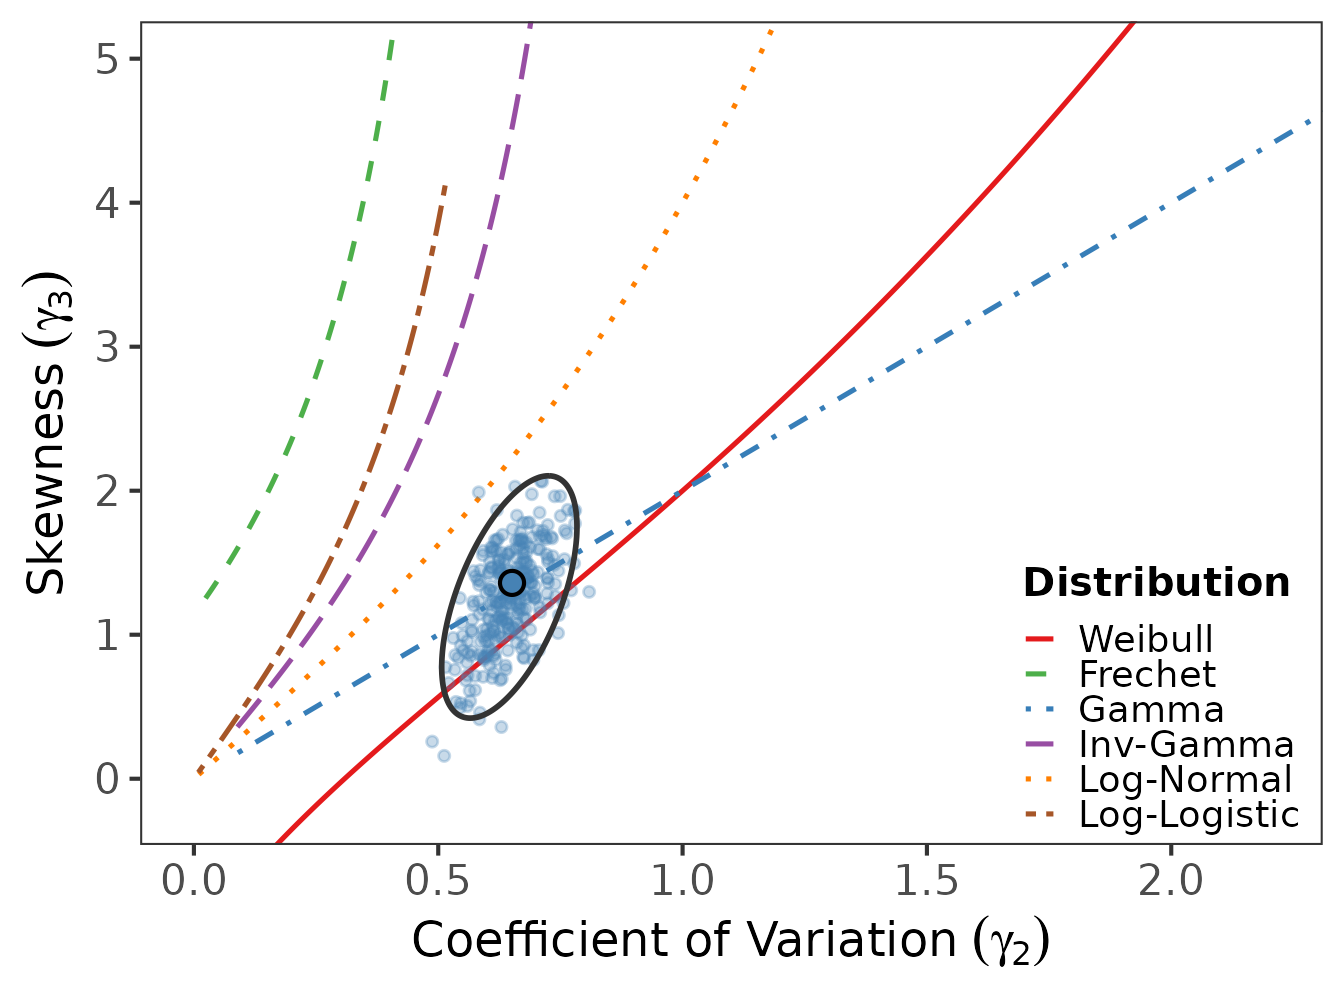
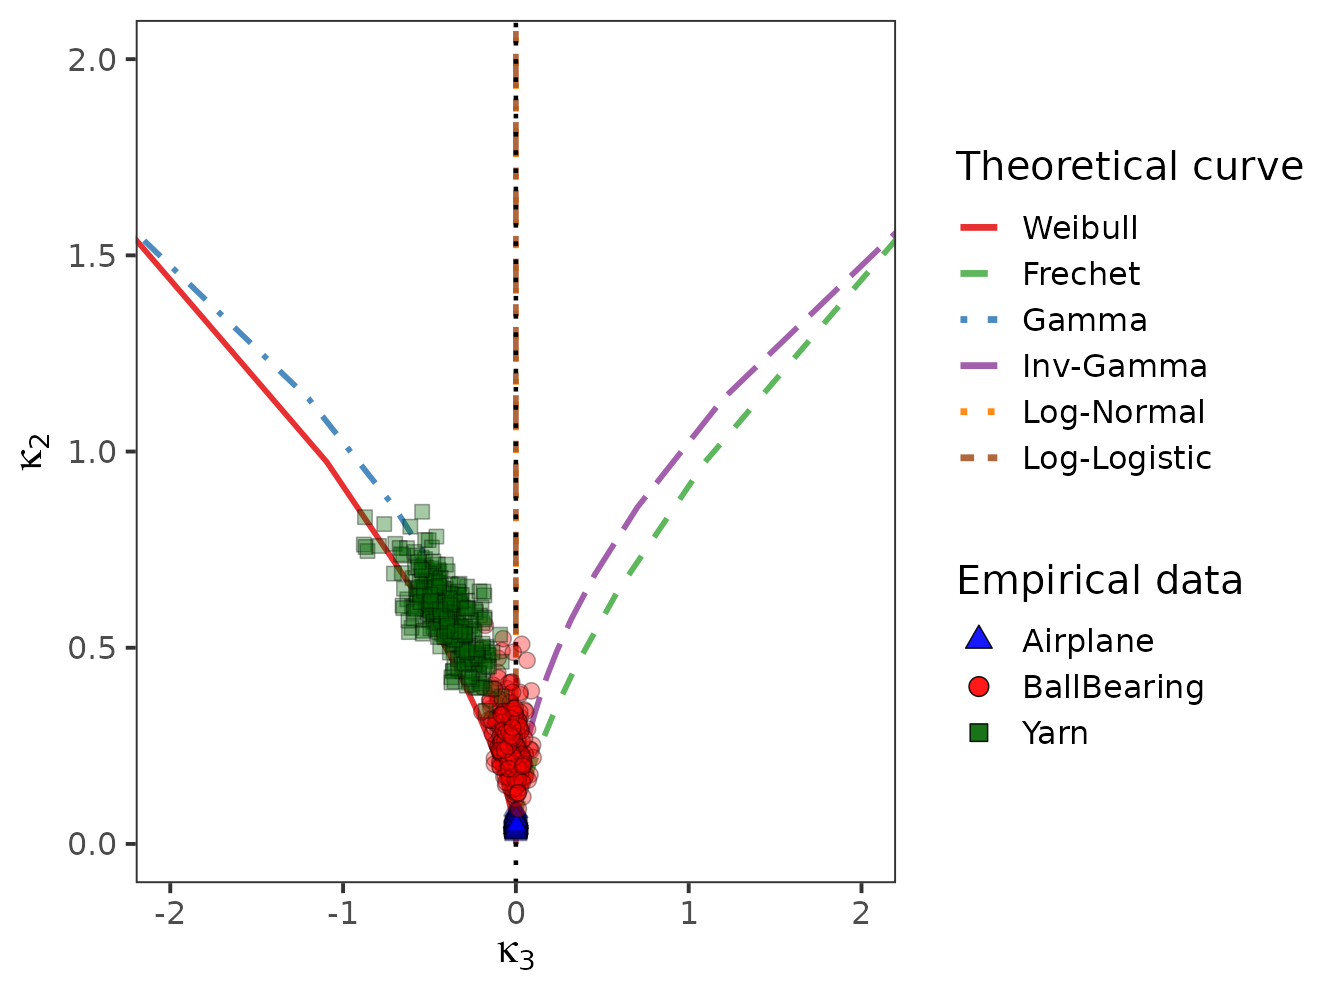
Several datasets on one diagram
multi_lc_diagram() overlays bootstrap clouds for several
datasets, distinguished by colour and plotting symbol.
multi_lc_diagram(
  reliability_datasets[c("Airplane", "BallBearing", "Yarn")],
  B = 300
)