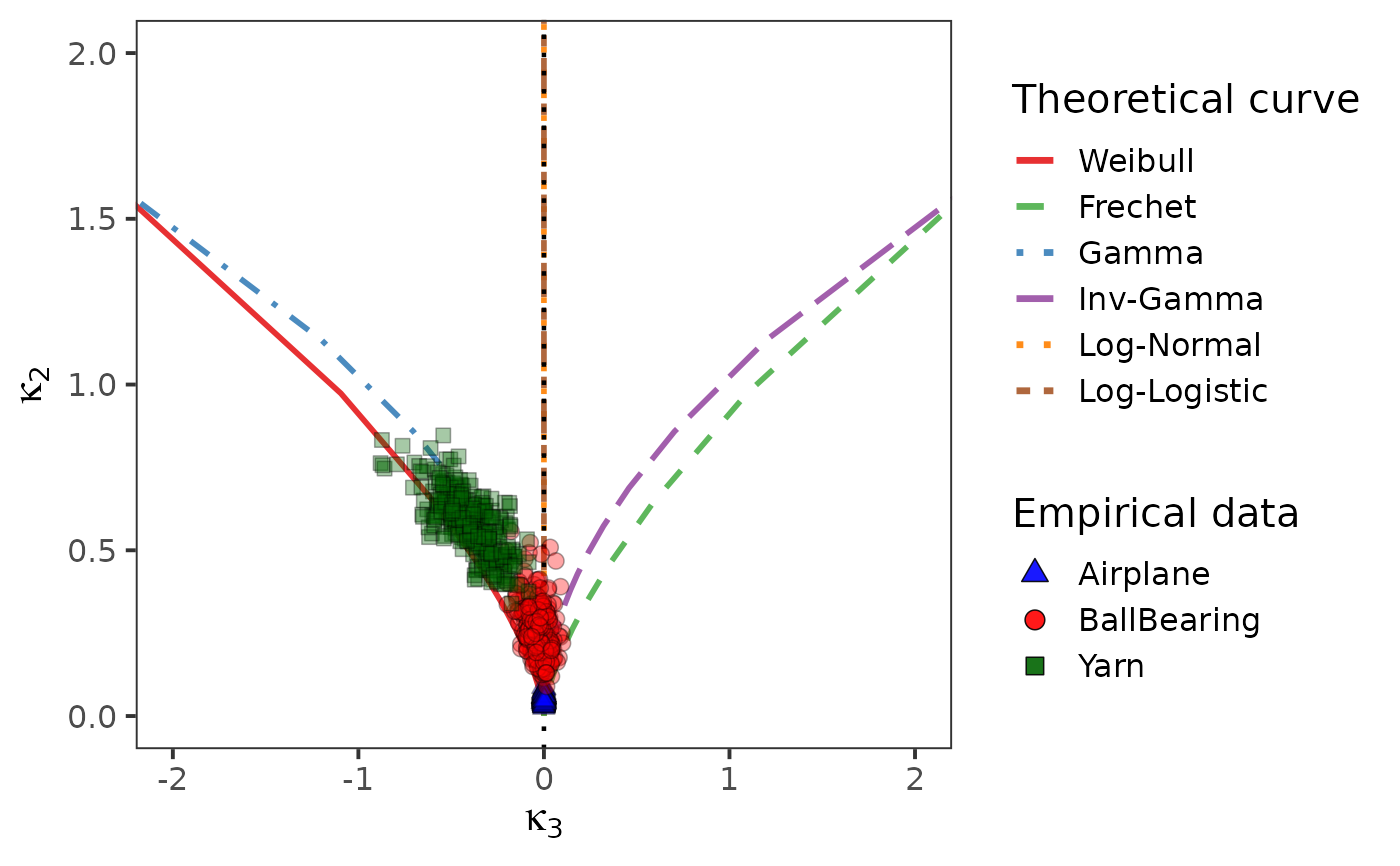
Overlays bootstrap clouds for several datasets on the log-cumulant diagram,
distinguishing datasets by colour and plotting symbol (the “empirical
data” legend) while the theoretical loci keep the “theoretical curve”
legend.
Usage
multi_lc_diagram(
  datasets_list,
  dataset_names = NULL,
  B = 1000,
  seed = 42,
  xlim = c(-2, 2),
  ylim = c(0, 2),
  alpha_points = 0.35,
  point_size = 2.6
)
Arguments
- datasets_list
Named list of numeric vectors.
- dataset_names
Optional character vector of names to use.
- B
Integer; bootstrap replicates per dataset.
- seed
Integer random seed.
- xlim, ylim
Numeric length-2 axis limits.
- alpha_points
Numeric; point transparency.
- point_size
Numeric; point size.
Examples
data(reliability_datasets)
multi_lc_diagram(reliability_datasets[c("Airplane","BallBearing","Yarn")], B = 300)