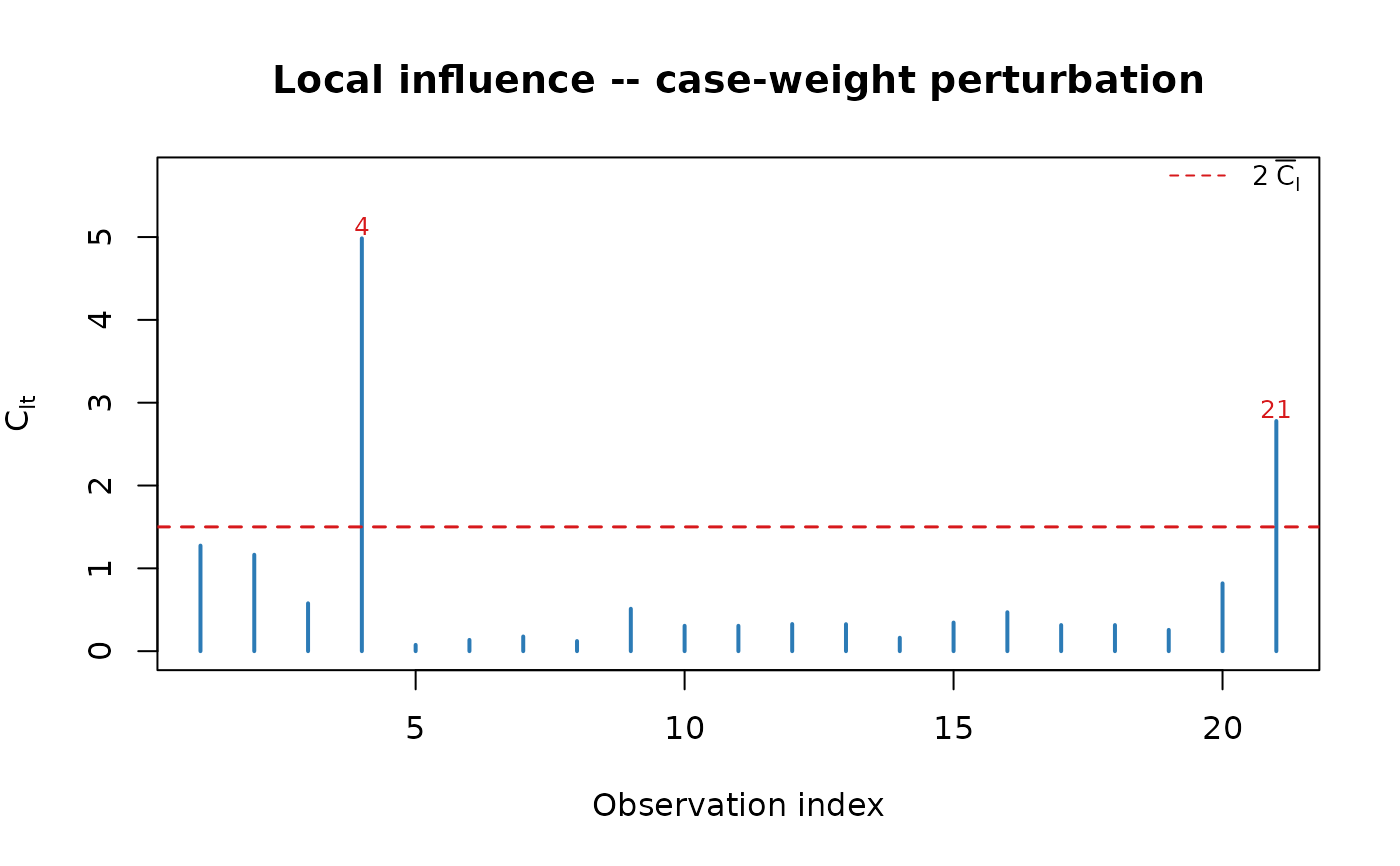
Plots the total local-influence measure \(C_{I_t}\) for each observation under case-weight perturbation, as used in the companion article (Ospina et al., 2026, Figure 2). A horizontal reference line at \(2 \bar{C}_I\) flags potentially influential observations.
Usage
plot_influence(
  x,
  threshold = 2,
  col.bar = "#2c7bb6",
  col.line = "#d7191c",
  label = TRUE,
  main = "Local influence -- case-weight perturbation",
  xlab = "Observation index",
  ylab = expression(C[It]),
  ...
)
Arguments
- x
A
"simplexfit"object fromsimplex_fit, or a list containing at least$Cei(influence vector of length \(n\)) as returned bysimplex_diag.- threshold
Numeric scalar; multiplier for the mean of \(C_{I_t}\) used to draw the reference line. Default 2.
- col.bar
Colour for the bars. Default
"#2c7bb6".- col.line
Colour for the reference line. Default
"#d7191c".- label
Logical; whether to label bars above the threshold with their index. Default
TRUE.- main, xlab, ylab
Plot title and axis labels.
- ...
Additional arguments passed to
plot.
Examples
data(ammonia)
X <- cbind(1, ammonia$corr_ar, ammonia$temp_agua,
           ammonia$corr_ar * ammonia$temp_agua)
Z <- cbind(1, ammonia$temp_agua,
           ammonia$corr_ar * ammonia$temp_agua)
fit <- simplex_fit(ammonia$perda, X, Z)
dg  <- simplex_diag(fit)
plot_influence(dg)