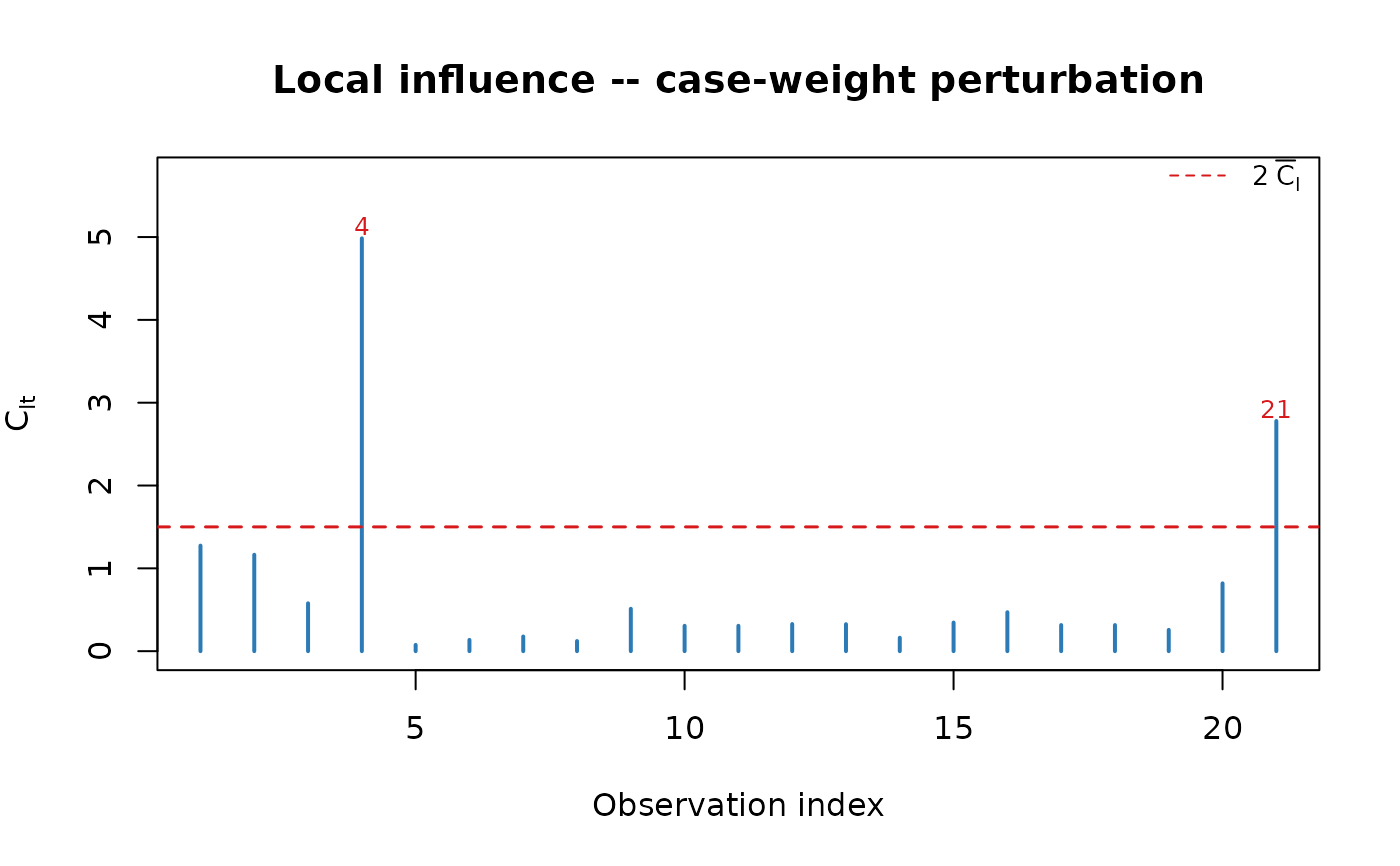
plot method for objects of class "simplexfit". Produces
influence index plots and/or a half-normal plot with simulated envelope.
Usage
# S3 method for class 'simplexfit'
plot(
  x,
  which = c("influence", "envelope"),
  ask = length(which) > 1 && dev.interactive(),
  ...
)
Arguments
- x
An object of class
"simplexfit"returned bysimplex_fit.- which
Character vector indicating which plots to produce:
"influence"for the influence index plot (seeplot_influence), and/or"envelope"for the half-normal plot with simulated envelope (seeplot_envelope). Several can be requested at once.- ask
Logical; if
TRUEand more than one plot is requested, the user is asked before each new plot. Defaults tolength(which) > 1 && dev.interactive().- ...
Further arguments passed to
plot_influenceorplot_envelope.
Examples
data(ammonia)
X <- cbind(1, ammonia$corr_ar, ammonia$temp_agua,
           ammonia$corr_ar * ammonia$temp_agua)
Z <- cbind(1, ammonia$temp_agua,
           ammonia$corr_ar * ammonia$temp_agua)
fit <- simplex_fit(ammonia$perda, X, Z)
plot(fit, which = "influence")